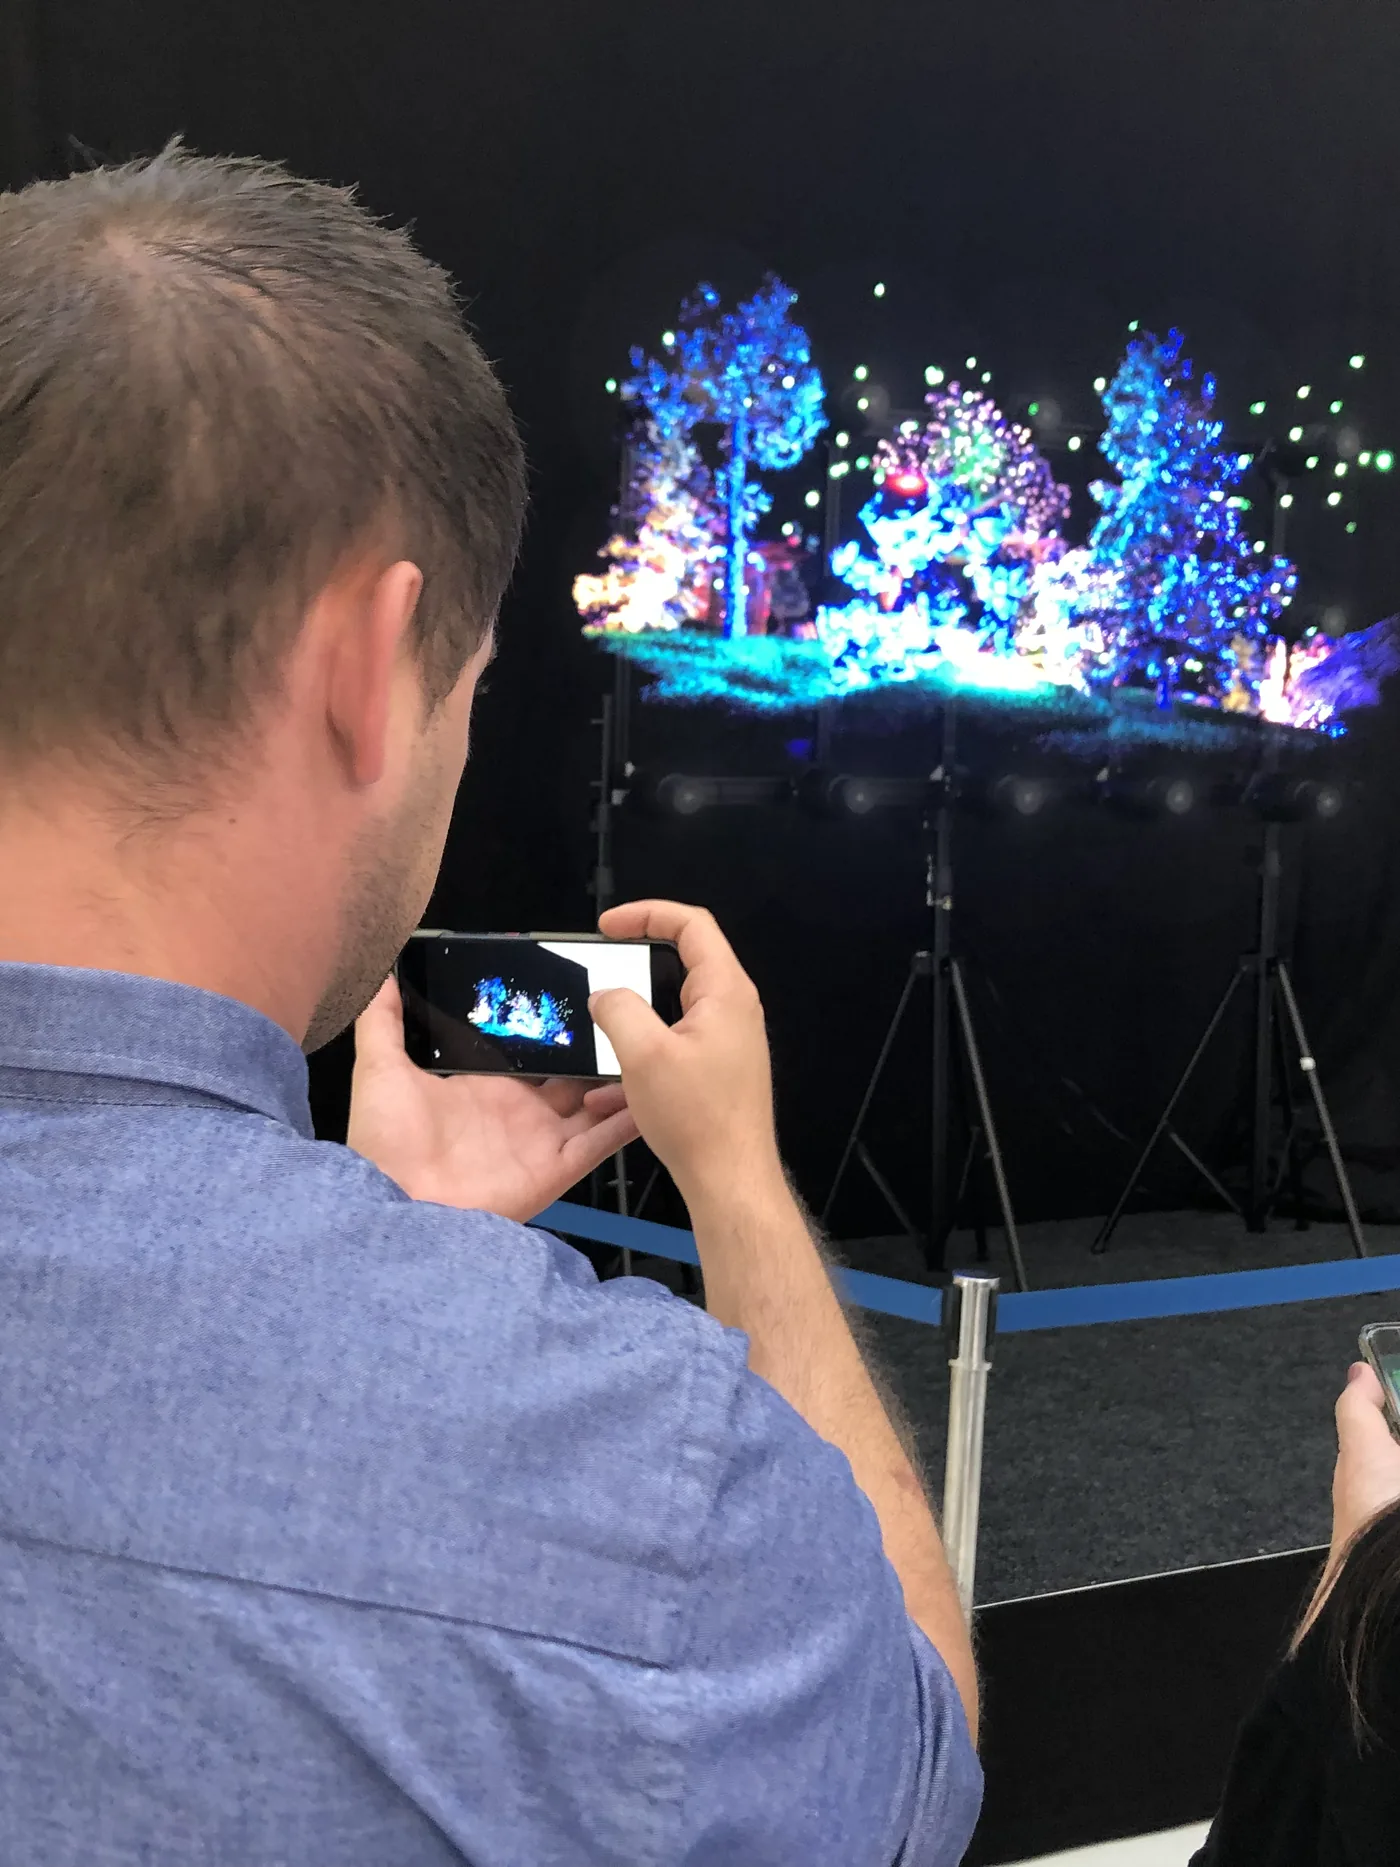
In advertising, holographic displays attract attention, but most of the performance figures in circulation come from manufacturers’ own case studies, and independent measurement remains scarce. This article explains what those figures actually measure, which indicators to track on your own installation and how to calculate the return on a holographic campaign correctly.
On this page
Key takeaways
- Mordor Intelligence estimates the holographic display market at USD 5.14 billion in 2026 and expects it to reach USD 11.66 billion by 2031, a compound annual growth rate of 17.82%.
- Most published performance figures for holographic advertising (viewing time, visibility, recall) come from manufacturers’ own case studies, not from independent research: read them as indications, not as benchmarks.
- Measure on your own site: anonymous counting, stop rate, dwell time and sales of the promoted products, before and after installation, ideally against control stores.
- ROI = (gains − costs) / costs, where gains are the additional margin rather than revenue, and costs cover hardware, 3D content, installation, maintenance and licences.
- Start with a limited pilot and KPIs defined in advance before rolling out further.
The holographic display market: size and growth
According to Mordor Intelligence (2026), the global holographic display market is estimated at USD 5.14 billion in 2026 and is expected to reach USD 11.66 billion by 2031, a compound annual growth rate (CAGR) of 17.82%. At that rate, the market would more than double in five years.
Other research firms publish different figures, sometimes far apart, because each defines the market in its own way. For a buyer, the trend matters more than the exact amount.
This figure covers every use of holographic displays, not only advertising. In advertising, several factors work in favour of holography: the declining effectiveness of traditional advertising, technical progress that makes the solutions more accessible, and growing demand for immersive and memorable experiences.
The technology is used in particular in luxury retail, the automotive sector and premium hospitality, in Switzerland as elsewhere in Europe, by companies that want to stand out in highly competitive markets.
The attention crisis favouring holography
Many consumers actively avoid advertising. The Nielsen 2023 Consumer Survey Report (3’000 US consumers, fieldwork April 2023) found that 64% of consumers intentionally take action to avoid ads on free, ad-supported video services. Online, standard banner advertisements are now very rarely clicked. Facing this digital saturation, brands are looking for formats that capture attention in a more authentic way.
Holographic displays address this problem head-on. Unlike flat screens, which blend into the everyday visual environment, a 3D hologram seems to float in the air. This novelty draws the eye, which flat formats now struggle to do.
What manufacturer figures actually measure
Viewing and engagement time
The most frequently cited metric is viewing time. The manufacturer HYPERVSN reports longer viewing and engagement time than with standard 2D Digital Signage, and a higher chance that the message is seen, including compared with print. These figures come from its own case studies, carried out with third-party data providers, not from independent research. They show a trend, not a benchmark you can apply to your own site as it stands.
More viewing time means more exposure for the message. Whether that exposure turns into sales is what your own measurement has to establish.
Recall and information perception
It is often argued that content perceived as an object in space is remembered better than a flat image. HYPERVSN’s case studies point in that direction, with better perception of the information shown, but independent studies of recall remain scarce. If your campaign aims at brand awareness, recall is an indicator to measure yourself, for example with a short survey of visitors.
Published case studies: what they really prove
A launch campaign at Zurich main station
The most relevant example for the Swiss market is a 2021 campaign by an international soft-drink brand launching the new flavour of its sugar-free drink. Holographic slot machines built on HYPERVSN Slots and Solo L devices were installed at Zurich main station.
According to the case study published by HYPERVSN, the brand followed up with a Christmas campaign across Switzerland in December of the same year. The case study reports participation figures, not the effect on sales: a repeat campaign shows that the brand valued the format, but it does not measure the return.
A retail test without published results
In 2019, a large retail group tested HYPERVSN holograms in two of its stores for Halloween, including a 24-unit holographic wall above the fitting rooms, according to HYPERVSN. No results of this test have been published, so it says nothing about the return.
The lesson for your own project: a well-known name or a repeat campaign is not proof of return. What counts is a measurement defined before installation and compared with a clear baseline.
Uses by sector and what to measure
Luxury and premium retail
Luxury is particularly fertile ground for holographic advertising. For a fine-watch campaign in the windows of a London department store in 2023, an agency installed HYPERVSN holograms presenting several watch brands, according to the use cases published by HYPERVSN. The innovative character of the technology matches the premium positioning of these brands.
For these brands, return is measured not only in direct sales but also in brand image and shared content: a striking installation can be widely shared on social media, which extends the campaign’s reach beyond the point of sale.
Automotive sector
In the automotive sector, holography is used to present vehicles in three dimensions, for example at motor shows or in showrooms.
A hologram can show technical details, interior finishes or a mechanism in operation, which a poster or a flat screen shows less well. Here, return is measured in visitors and follow-up requests rather than in immediate sales.
Events and trade shows
At a trade show, stands compete for visitors’ attention. A hologram often acts as a crowd puller: visitors gather around it, and a group in front of a stand attracts more visitors.
At events, return is measured in qualified leads. To judge the effect of a hologram, compare the number of qualified contacts with a previous edition of the same show, or with a stand without a hologram.
Banking and financial services
In the financial sector, a bank in Cambodia installed a HYPERVSN holographic wall in one of its larger branches to attract new customers and retain existing ones, according to HYPERVSN. Holography is therefore not limited to retail.
A hologram can also make an abstract product, such as a savings or investment product, easier to picture. Whether it improves customers’ understanding and sales is, again, something to measure.
Calculating your holographic investment ROI
Cost components
A holographic investment includes several budget items. Hardware is the base: individual devices, whether HYPERVSN 3D hologram fans or other solutions, vary with size and features. Multi-unit holographic walls allow large formats but increase the budget in proportion.
3D content creation is an often underestimated item. Unlike 2D visuals, holographic animations require specialised 3D modelling and animation skills. Some suppliers offer simplified creation tools, but premium content generally requires a specialised studio.
Installation, maintenance and any software licences complete the total cost of ownership (TCO). A TCO analysis over three to five years gives a sound basis for judging the profitability of the investment.
Performance metrics to track
To measure the actual ROI, track a few indicators. Anonymous counting of passers-by in front of the installation shows how much traffic it attracts; people-counting sensors or anonymous video analysis provide this data objectively.
The stop rate (the share of passers-by who stop) and dwell time (how long they stay in front of the display) show whether the content holds attention. Some solutions measure them automatically. A longer dwell time is a good sign, but it only becomes a return once it shows up in sales.
Sales of the promoted products remain the decisive indicator. A before-and-after comparison, ideally with control stores, separates the effect of the hologram from other marketing factors.
Calculation methodology
ROI is calculated with the standard formula: ROI = (gains − costs) / costs × 100, expressed as a percentage. For a holographic installation, gains include the additional margin on the sales attributable to it (margin, not revenue), savings on other marketing media it replaces and, harder to quantify, the value added to the brand image. Costs include all the items above, over the same period.
The payback period depends on how intensively the installation is used and on the sector: in high-turnover retail, additional sales show up faster than in sectors with long sales cycles.
Success factors for maximising ROI
Strategic placement
The position of a holographic installation directly affects its effectiveness. High-traffic areas with good visibility maximise exposure. Viewing angle and lighting conditions must be studied: holograms work best where there is enough contrast with the background.
Shop windows facing the street reach a wide audience and draw people into the shop. Installations inside, close to the promoted products, make it easier to buy on the spot. The best approach often combines several complementary locations.
Content quality and relevance
3D content largely determines the success of the investment. Smooth animations, precisely modelled products and clear messages maximise impact. Conversely, poor-quality content can harm the brand image, however sophisticated the medium.
Changing the content regularly keeps returning visitors interested. An editorial calendar aligned with commercial peaks and product launches keeps the messages relevant.
Omnichannel integration
Holography reaches its full potential as part of an overall marketing strategy. Visual consistency with other communication media reinforces brand identity. Clear calls to action that connect the physical experience with digital channels extend engagement beyond the hologram itself.
Interactive features, such as presence sensors or gesture control, provide anonymous data on how people interact with the display. This data helps to adjust campaigns over time.
Future outlook: AI and conversational avatars
Integrating artificial intelligence into holographic systems opens up new ways of personalising content, adapted in real time to the audience in front of the display. Like everything else, the effect of this personalisation on conversion will have to be measured.
AI-driven holographic avatars that can hold a conversation are the next step: they combine the visual impact of a hologram with the ability to answer visitors’ questions, as in our case study of a holographic avatar at a Swiss university reception.
Recommendations for getting started
To explore the potential of holographic advertising, a gradual approach is essential. A limited pilot at a representative point of sale tests the performance assumptions in your own context. HYPERVISUAL rents out individual HYPERVSN holograms, so a pilot does not require a purchase; multi-unit holographic walls, however, are for sale only.
Defining clear KPIs in advance and putting the right measurement tools in place are what make it possible to demonstrate ROI. Without a baseline and a tracking system, the evaluation will remain qualitative and will not convince budget decision-makers.
An experienced integrator can advise on the right hardware, the content and the placement of the installation, which reduces the risks.